 Some Highlights:
SOURCE KCM #HomePrice #InterestRates #SimardRealtyGroup #eXpRealty
0 Comments
Housing inventory is up year-over-year for the first time in three years which means that home price appreciation will likely begin to slow. If you're looking to buy or sell a home, now is still a great time! Let's get together today to go over what this shift in the market means for you.
 We are beginning to see reports that more housing inventory is coming to the market and that buyer demand may not be increasing at the same pace it did earlier this year. The result will be many headlines written to address the impact that these two situations will have on home values.
Many of these headline writers will confuse “softening home prices” with “falling home prices,” but there is a major difference between the two. The data will begin to show that home values are not appreciating at the same levels as they had over the last several years (softening prices). This does NOT mean that prices are depreciating (falling prices). Here is an example: Over the last several years, national home values increased by more than 6% annually. If you had a home worth $300,000 at the beginning of the year, it would be worth $318,000 by year’s end. If the appreciation rate “falls” to 4%, that $300,000 house would be worth $312,000 at the end of next year – a $6,000 difference. The price of the home did not fall. It just didn’t increase at the level it had the previous year. Appreciation rates are projected to end this year at approximately 5%, and then drop to somewhere between 4-5% next year. This drop in appreciation rate will cause home price increases to soften. Again, this does not mean that home prices will depreciate, but instead that they will appreciate more slowly. Bottom Line Be careful when reading headlines that discuss home values. Some headline writers will be legitimately confused and will use the word falling in place of softening. Others will realize that the headline “Home Prices are Falling!” will get more clicks than “Home Prices are Softening” and will intentionally write the more compelling headline. Read the article. If the word depreciation is not mentioned, home values are not falling. Source KCM #ForBuyers #ForSellers #SimardRealtyGroup #eXprealty
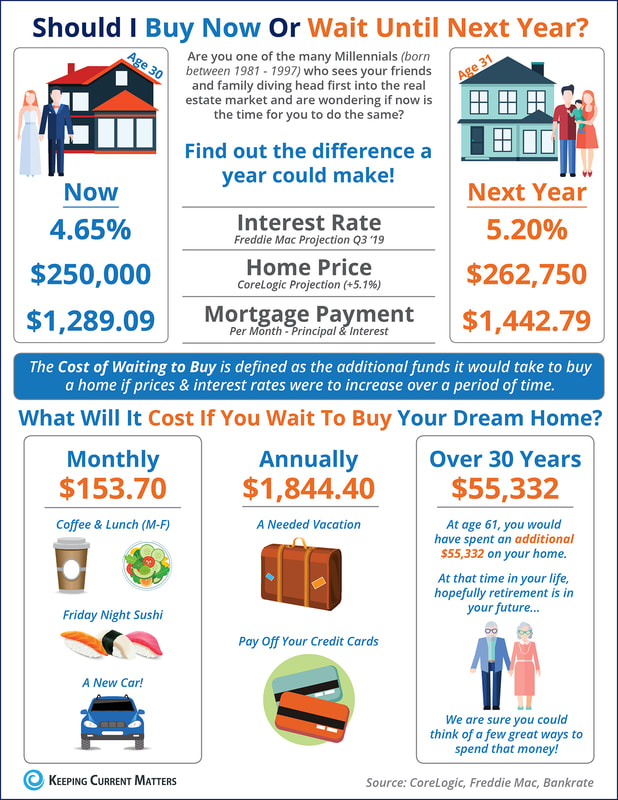
Looking at the percentage of income needed to rent a median-priced home today (28.8%) vs. the percentage needed to buy a median-priced home (17.1%), the choice to buy is obvious.
 Saving for a down payment is often the biggest hurdle for a first-time homebuyer as median incomes, rents, and home prices all vary depending on where you live. There is a common misconception among homebuyers that a 20% down payment is required, and it is this limiting belief that often adds months, and sometimes even years, to the home-buying process. So, if you can purchase a home with less than a 20% down payment… why aren’t more people doing just that?One Possible Answer: Private Mortgage Insurance (PMI) Freddie Mac defines PMI as: “An insurance policy that protects the lender if you are unable to pay your mortgage. It’s a monthly fee, rolled into your mortgage payment, that is required for all conforming, conventional loans that have down payments less than 20%. Once you’ve built equity of 20% in your home, you can cancel your PMI and remove that expense from your mortgage payment.” As the borrower, you pay the monthly premiums for the insurance policy, and the lender is the beneficiary. The monthly cost of your PMI depends on the home’s value, the amount of your down payment, and your credit score. Below is a table showing the difference in monthly mortgage payment for a $250,000 home with a 3% down payment and PMI vs. a 20% down payment without PMI: 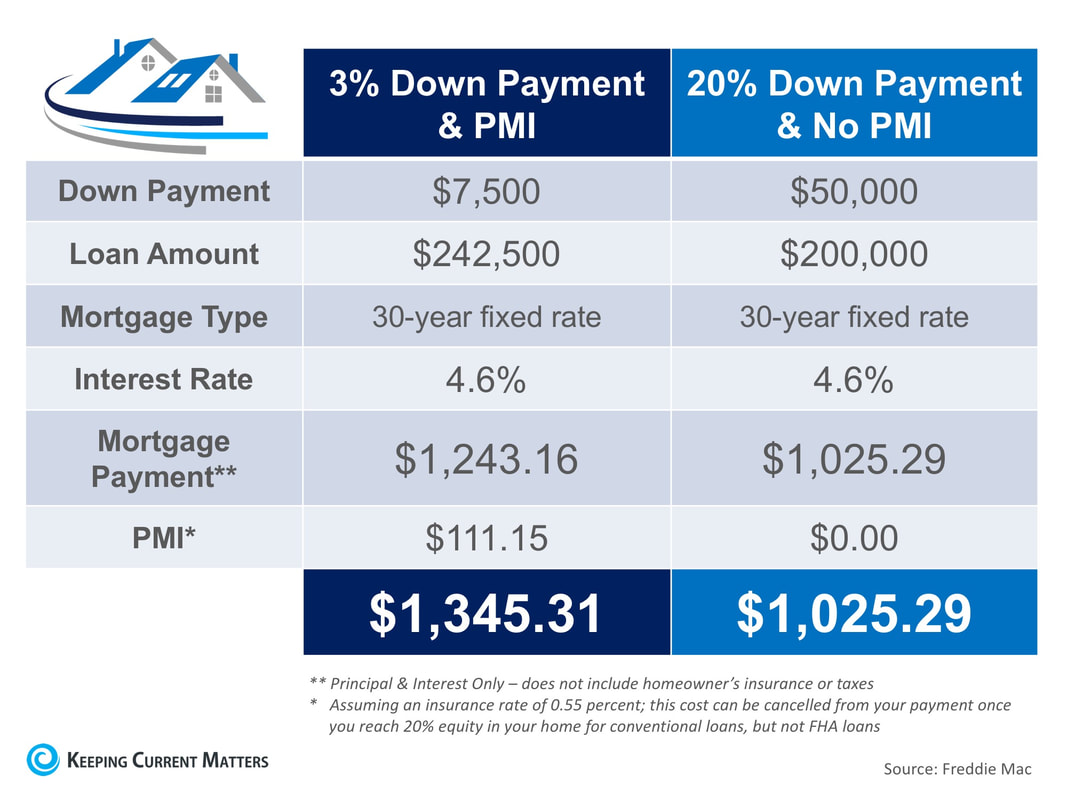 The first thing you see when looking at the table above is no doubt the added $320 a month that you would be spending on your monthly mortgage cost. The second thing that should stand out is that a 20% down payment is $50,000! If you are buying your first home, $50,000 is a large sum of money that takes discipline and sacrifice to save. Many first-time buyers save for 5-10 years before buying their homes. To save $50,000 in 10 years, you would need to save about $420 a month. On the other hand, if you save that same $420 a month, you could afford a 3% down payment in less than a year and a half. In a recent article by My Mortgage Insider, they explain what could happen in the market while you are waiting to save for a higher down payment: “The time it takes to save a (larger) down payment could mean higher home prices and tougher qualifying down the road. For many buyers, it could prove much cheaper and quicker to opt for the 3% down mortgage immediately.” The article went on to say, “Since renters typically devote a higher percentage of their income to housing than homeowners, providing flexible down payment options can help renters with solid earnings purchase a home – and gain a fixed-rate mortgage with principal and interest payments that will not increase over the life of the loan.” If the prospect of having to pay PMI is holding you back from buying a home today, Freddie Mac has this advice, “It’s no doubt an added cost, but it’s enabling you to buy now and begin building equity versus waiting 5 to 10 years to build enough savings for a 20% down payment.” Based on results of the most recent Home Price Expectation Survey, a homeowner who purchased a $250,000 home in January would gain $50,000 in equity over the next five years based on home price appreciation alone (shown below). 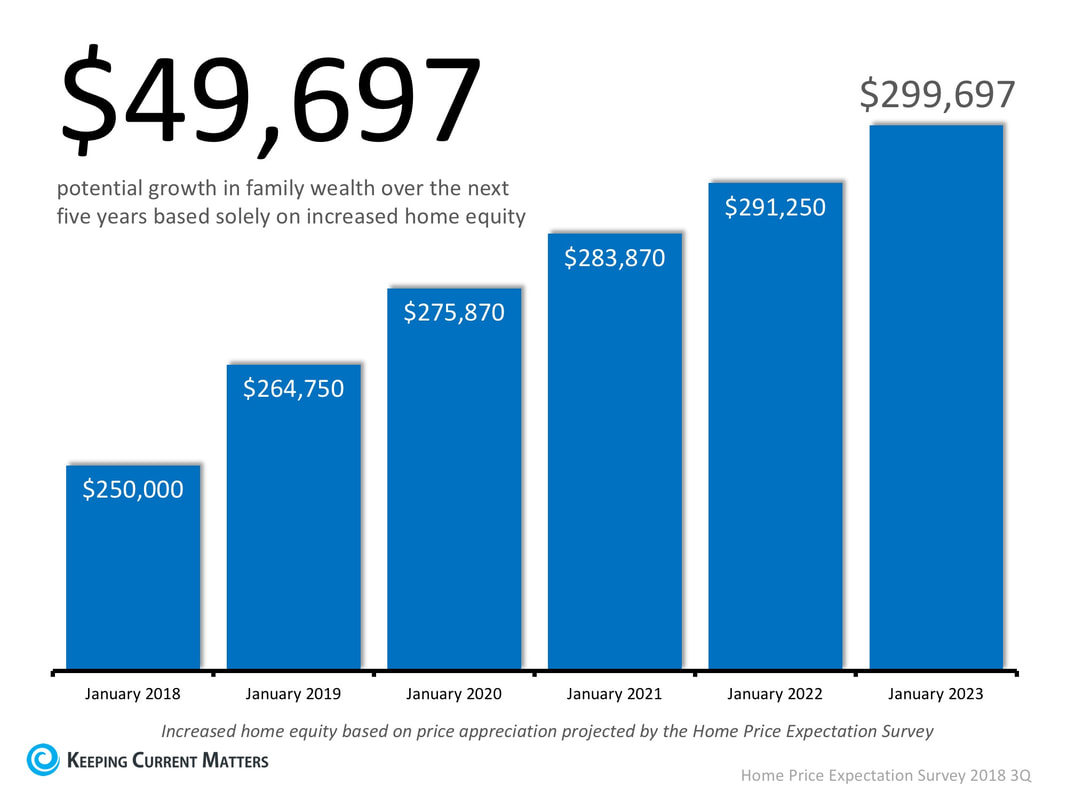 Bottom Line
If you have questions about whether you should buy now or wait until you’ve saved a larger down payment, meet with a professional in your area who can explain your market’s conditions and help you make the best decision for you and your family. SOURCE KCM #BuyingMyths #DownPayments #SimardRealtyGroup #joineXpRealty  Home values have risen dramatically over the last twelve months. In CoreLogic’s most recent Home Price Index Report, they revealed that national home prices have increased by 6.2% year-over-year. CoreLogic broke down appreciation even further into four price ranges, giving us a more detailed view than if we had simply looked at the year-over-year increases in national median home price. The chart below shows the four price ranges from the report, as well as each one’s year-over-year growth from July 2017 to July 2018 (the latest data available). 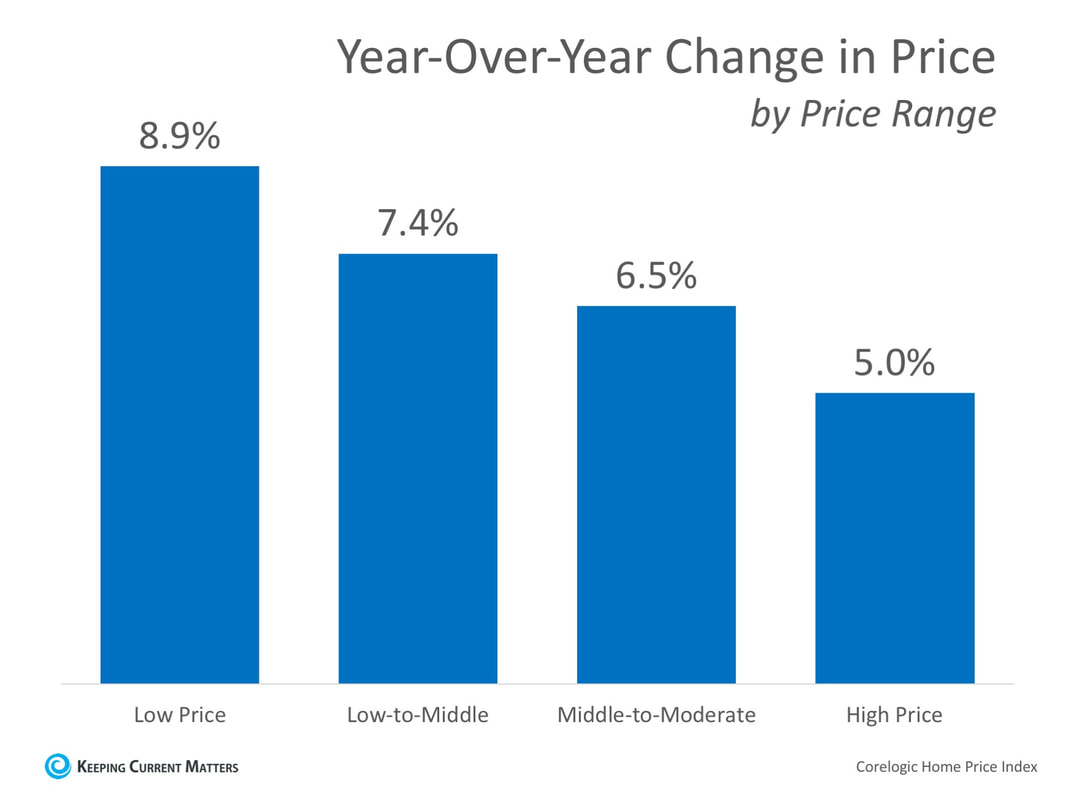 It is important to pay attention to how prices are changing in your local market. The location of your home is not the only factor which determines how much your home has appreciated over the course of the last year.
Lower-priced homes have appreciated at greater rates than homes at the upper ends of the spectrum due to demand from first-time home buyers and baby boomers looking to downsize. Bottom Line If you are planning to list your home for sale in today’s market, find a local agent who can explain exactly what’s going on in your area and your price range. SOURCE KCM #ForBuyers #ForSellers #Pricing #SimardRealtyGroup #eXpRealty  Some Highlights:
SOURCE KCM #infographics #moveupbuyer #SimardRealtyGroup #eXpRealty 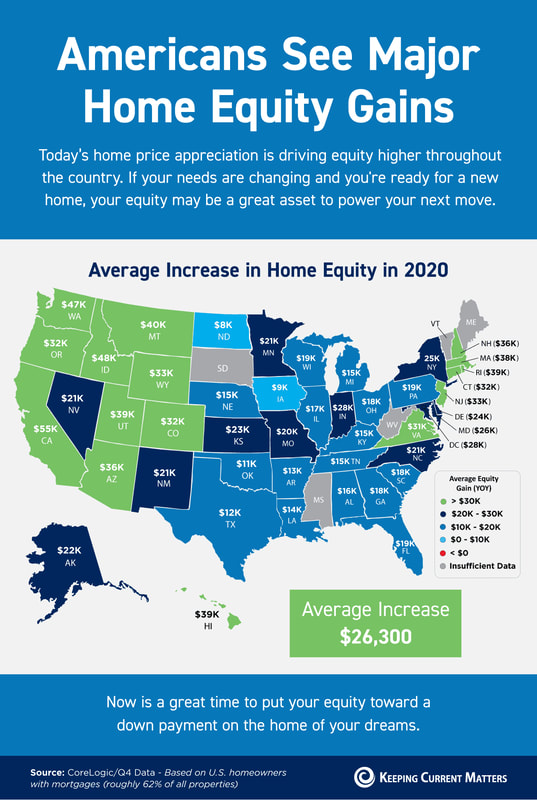 The housing market has been anything but normal for the last eleven years. In a normal real estate market, home prices appreciate 3.7% annually. Below, however, are the price swings since 2007 according to the latest Home Price Expectation Survey:
After the bubble burst in June 2007, values depreciated 6.1% annually until February 2012. From March 2012 to today, the market has been recovering with values appreciating 6.2% annually. These wild swings in values were caused by abnormal ratios between the available supply of inventory and buyer demand in the market. In a normal market, there would be a 6-month supply of housing inventory. When the market hit its peak in 2007, homeowners and builders were trying to take advantage of a market that was fueled by an “irrational exuberance.” Inventory levels grew to 7+ months. With that many homes available for sale, there weren’t enough buyers to satisfy the number of homeowners/builders trying to sell, so prices began to fall. Then, foreclosures came to market. We eventually hit 11 months inventory which caused prices to crash until early 2012. By that time, inventory levels had fallen to 6.2 months and the market began its recovery. Over the last five years, inventory levels have remained well below the 6-month supply needed for prices to continue to level off. As a result, home prices have increased over that time at percentages well above the appreciation levels seen in a more normal market. That was the past. What about the future? We currently have about 4.5-months inventory. This means prices should continue to appreciate at above-normal levels which most experts believe will happen for the next year. However, two things have just occurred that are pointing to the fact that we may be returning to a more normal market. 1. Listing Supply is Increasing Both existing and new construction inventory is on the rise. The latest Existing Home Sales Report from the National Association of Realtors revealed that inventory has increased over the last two months after thirty-seven consecutive months of declining inventory. At the same time, building permits are also increasingwhich means more new construction is about to come to market. 2. Buyer Demand is Softening Ivy Zelman, who is widely respected as an industry expert, reported in her latest ‘Z’ Report: “While we continue to expect a resumption of growth in resale transactions on the back of easing inventory in 2019 and 2020, our real-time view into the market through our Real Estate Broker Survey does suggest that buyers have grown more discerning of late and a level of “pause” has taken hold in many large housing markets. Indicative of this, our broker contacts rated buyer demand at 69 on a 0- 100 scale, still above average but down from 74 last year and representing the largest year-over-year decline in the two-year history of our survey.” With supply increasing and demand waning, we may soon be back to a more normal real estate market. We will no longer be in a buyers’ market (like 2007-February 2012) or a sellers’ market (like March 2012- Today). Prices won’t appreciate at the levels we’ve seen recently, nor will they depreciate. It will be a balanced market where prices remain steady, where buyers will be better able to afford a home, and where sellers will more easily be able to move-up or move-down to a home that better suits their current lifestyles. Bottom Line Returning to a normal market is a good thing. However, after the zaniness of the last eleven years, it might feel strange. If you are going 85 miles per hour on a road with a 60 MPH speed limit and you see a police car ahead, you’re going to slow down quickly. But, after going 85 MPH, 60 MPH will feel like you’re crawling. It is the normal speed limit, yet, it will feel strange. That’s what is about to happen in real estate. The housing market is not falling apart. We are just returning to a more normal market which, in the long run, will be much healthier for you whether you are a buyer or a seller. SOURCE KCM #HousingMarket #Buyers #Sellers #SimardRealtyGroup #eXpRealty  Rising home prices have been in the news a lot lately and much of the focus has been on whether home prices are accelerating too quickly, as well as how sustainable the growth in prices really is. One of the often-overlooked benefits of rising prices, however, is the impact that they have on a homeowner’s equity position. Home equity is defined as the difference between the home’s fair market value and the outstanding balance of all liens (loans) on the property. While homeowners pay down their mortgages, the amount of equity they have in their homes climbs each time the value of their homes go up! According to the latest Equity Report from ATTOM Data Solutions, “13.9 million U.S. properties in Q2 2018 were equity rich — where the combined estimated balance of loans secured by the property was 50 percent or less of the property’s estimated market value — representing 24.9% of all U.S. properties with a mortgage.” This means that nearly a quarter of Americans who have a mortgage would be able to sell their homes and have a significant down payment toward their next home. Many who sell could also use their new-found equity to pay off high-interest credit cards or help children with tuition costs. The map below shows the percentage of properties with a mortgage in each state that were equity rich in Q2 2018. 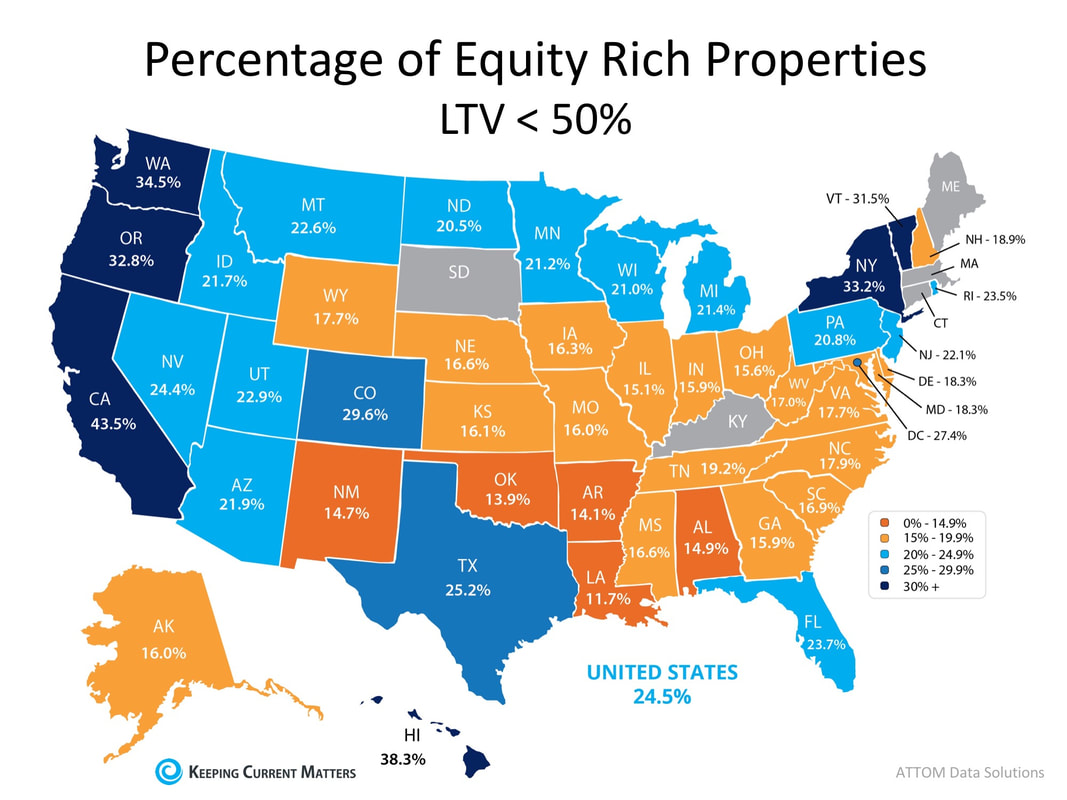 Bottom Line
If you are a homeowner looking to take advantage of your home equity by moving up to your dream home, contact an agent in your area to discuss your options! SOURCE KCM #ForSellers #Mortgage #SimardRealtyGroup #joineXpRealty  CoreLogic recently released their Home Price Index Report. One of the key indicators used in the report to determine the health of the housing market was home price appreciation. CoreLogic focused on appreciation from July 2013 to July 2018 to show how prices over the last five years have fared. The graph below was created to show the 5-year change in price from July 2013 to July 2018 by price range. 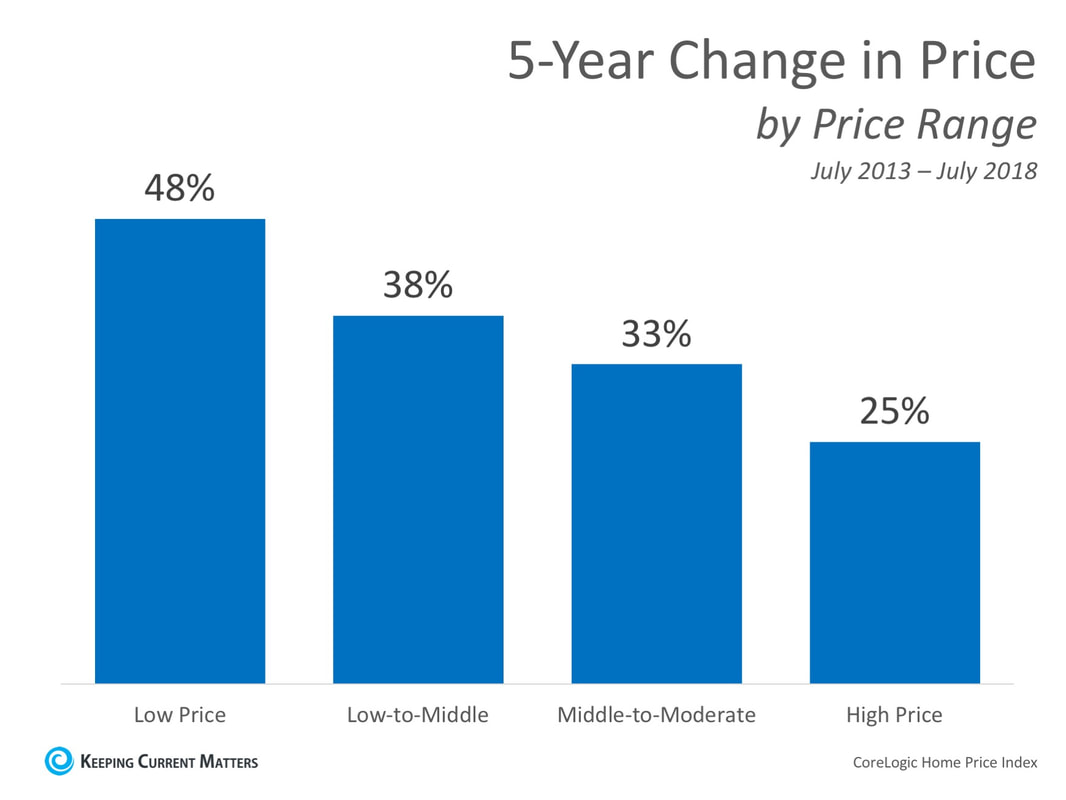 As you can see in the graph, the highest price appreciation occurred in the lowest price range with 48% growth, while the highest priced homes appreciated by 25%. This has been greatly fueled by the lack of inventory of homes available at the lower price ranges and high demand from first-time buyers looking to enter the market.
Where were prices expected to go? Every quarter, Pulsenomics surveys a nationwide panel of over 100 economists, real estate experts, and investment and market strategists and asks them to project how residential home prices will appreciate over the next five years for their Home Price Expectation Survey (HPES). According to the Q3 2014 survey results, national homes prices were projected to increase cumulatively by 19.5% by December 2018. The bulls of the group predicted home prices to rise by 27.8%, while the more cautious bears predicted an appreciation of 11.2%. Where are prices headed in the next 5 years? Data from the most recent HPES shows that home prices are expected to increase by 20.0% over the next 5 years. The bulls of the group predict home prices to rise by 31.2%, while the more cautious bears predict an appreciation of 9.3%. Bottom Line Every day, thousands of homeowners regain positive equity in their homes. Some homeowners are now experiencing values even greater than those before the Great Recession. If you’re wondering if you have enough equity to sell your house and move on to your dream home, contact a local real estate professional who can help! SOURCE KCM #Buyers #Sellers #Pricing #SimardRealtyGroup #eXpRealty |
Archives
October 2022
Categories
All
|
 RSS Feed