 Some homeowners have recently done a “cash out” refinance and have taken a portion of their increased equity from their house. Others have sold their homes and purchased more expensive homes with larger mortgages. At the same time, first-time buyers have become homeowners and now have mortgage payments for the first time. These developments have caused concern that families might be reaching unsustainable levels of mortgage debt. Some are worried that we may be repeating a behavior that helped precipitate the housing crash ten years ago. Today, we want to assure everyone that this is not the case. Here is a graph created from data released by the Federal Reserve Board which shows the Household Debt Service Ratio for mortgages as a percentage of disposable personal income. The ratio is the total quarterly required mortgage payments divided by total quarterly disposable personal income. In other words, the percentage of spendable income people are using to pay their mortgage. 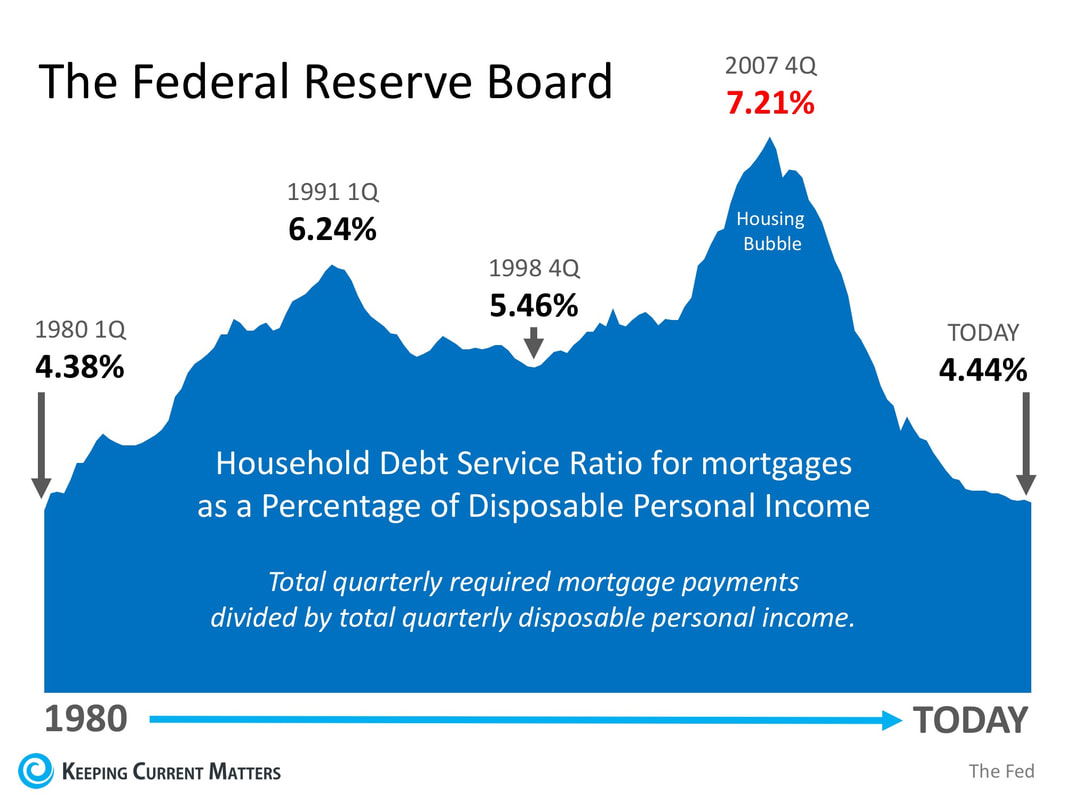 Today’s ratio of 4.44% is nowhere near the ratio of 7.21% during the peak of the housing bubble and is instead at the lowest rate since 1980 (4.38%).
Bill McBride of Calculated Risk recently commented on the ratio: “The Debt Service Ratio for mortgages is near the low for the last 38 years. This ratio increased rapidly during the housing bubble and continued to increase until 2007. With falling interest rates, and less mortgage debt, the mortgage ratio has declined significantly.” Bottom Line Many families paid a heavy price because of questionable practices that led to last decade’s housing crash. It seems the American people have learned a lesson and are not repeating that same behavior regarding their mortgage debt. SOURCE KCM #Buyers #Sellers #SimardRealtyGroup #eXpRealty
0 Comments
 It’s no mystery that cost of living varies drastically depending on where you live, so a new study by GOBankingRates set out to find out what minimum salary you would need to make in order to buy a median-priced home in each of the 50 states, and Washington, D.C. States in the Midwest came out on top as most affordable, requiring the smallest salaries in order to buy a median-priced home. States with large metropolitan areas saw a bump in the average salary needed to buy with California, Washington, D.C., and Hawaii edging out all others with the highest salaries required. Below is a map with the full results of the study: 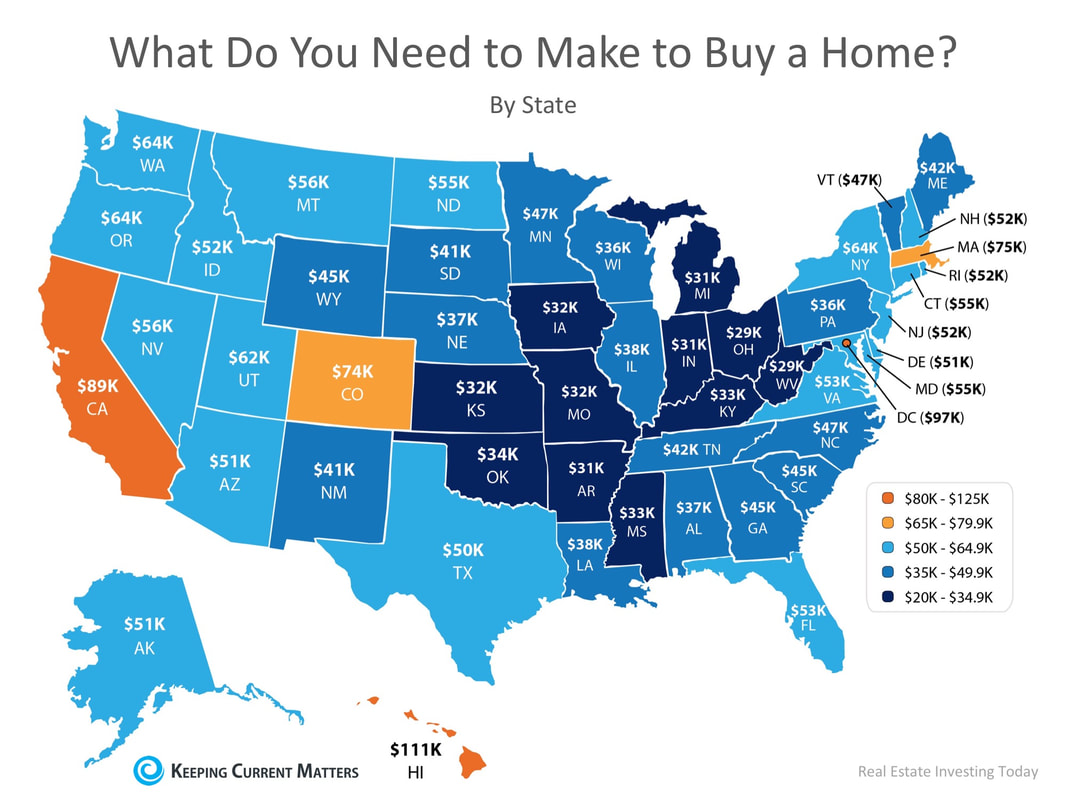 GoBankingRates gave this advice to anyone considering a home purchase,
“Before you buy a home, it’s important to find out if you can afford the monthly mortgage payment. To do this, some financial experts recommend your housing costs — primarily your mortgage payments — shouldn’t consume more than 30 percent of your monthly income.” As we recently reported, research from Zillow shows that historically, Americans had spent 21% of their income on owning a median-priced home. The latest data from the fourth quarter of 2017 shows that the percentage of income needed today is only 15.7%! Bottom Line If you are considering buying a home, whether it’s your first time or your fifth time, consult a local real estate professional who can help evaluate your ability to do so in today’s market! SOURCE KCM #Buyers #Connecticut #SimardRealtyGroup #eXpRealty  Over the next five years, home prices are expected to appreciate, on average, by 3.6% per year and to grow by 18.2% cumulatively, according to Pulsenomics’ most recent Home Price Expectation Survey. So, what does this mean for homeowners and their equity position? As an example, let’s assume a young couple purchased and closed on a $250,000 home this January. If we only look at the projected increase in the price of that home, how much equity will they earn over the next 5 years? 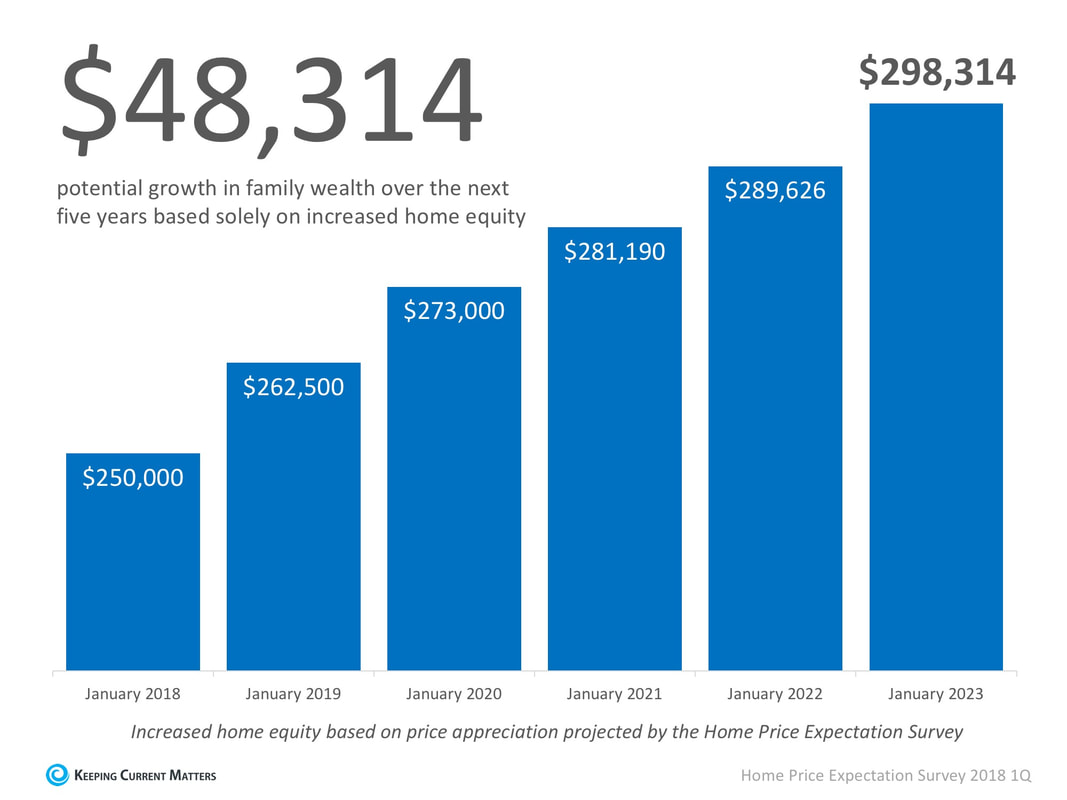 Since the experts predict that home prices will increase by 5.0% in 2018, the young homeowners will have gained $12,500 in equity in just one year.
Over a five-year period, their equity will increase by over $48,000! This figure does not even take into account their monthly principal mortgage payments. In many cases, home equity is one of the largest portions of a family’s overall net worth. Bottom Line Not only is homeownership something to be proud of, but it also offers you and your family the ability to build equity you can borrow against in the future. If you are ready and willing to buy, find out if you are able to today! SOURCE KCM #ForBuyers #SimardRealtyGroup #eXpRealty  In many markets across the country, the number of buyers searching for their dream homes greatly outnumbers the number of homes for sale. This has led to a competitive marketplace where buyers often need to stand out. One way to show you are serious about buying your dream home is to get pre-qualified or pre-approved for a mortgage before starting your search.
Even if you are in a market that is not as competitive, understanding your budget will give you the confidence of knowing if your dream home is within your reach. Freddie Mac lays out the advantages of pre-approval in the ‘My Home’ section of their website: “It’s highly recommended that you work with your lender to get pre-approved before you begin house hunting. Pre-approval will tell you how much home you can afford and can help you move faster, and with greater confidence, in competitive markets.” One of the many advantages of working with a local real estate professional is that many have relationships with lenders who will be able to help you with this process. Once you have selected a lender, you will need to fill out their loan application and provide them with important information regarding “your credit, debt, work history, down payment and residential history.” Freddie Mac describes the ‘4 Cs’ that help determine the amount you will be qualified to borrow:
Getting pre-approved is one of many steps that will show home sellers that you are serious about buying, and it often helps speed up the process once your offer has been accepted. Bottom Line Many potential home buyers overestimate the down payment and credit scores needed to qualify for a mortgage today. If you are ready and willing to buy, you may be pleasantly surprised at your ability to do so. SOURCE KCM #BuyingMyths #Preapproval #SimardRealtyGroup #eXpRealty  Some Highlights:
SOURCE KCM #ForBuyers #ForSellers #Infographics #SimardRealtyGroup #eXpRealty  There is no doubt that the price of a home in most regions of the country is greater now than at any time in history. However, when we look at the cost of a home, it is cheaper to own today than it has been historically. The Difference Between PRICE and COST The price of a home is the dollar amount you and the seller agree to at the time of purchase. The cost of a home is the monthly expense you pay for your mortgage payment. To accurately compare costs in different time periods, we must look at home prices, mortgage rates, and wages during each period. Home prices were less expensive years ago, but paychecks were also smaller and mortgage rates were much higher (the average mortgage interest rate in 1988 was 10.34%). The best way to measure the COST of a home is to determine what percentage of income is necessary to buy a home at the time. That would take into account the price of the home, the mortgage interest rate and wages at the time. Zillow just released research that examined home costs using this formula. The research compares the historic percentage of income necessary to afford a mortgage to the percentage needed today. It also revealed the cost if mortgage rates continue to rise as experts are predicting. Here is a graph of their findings* 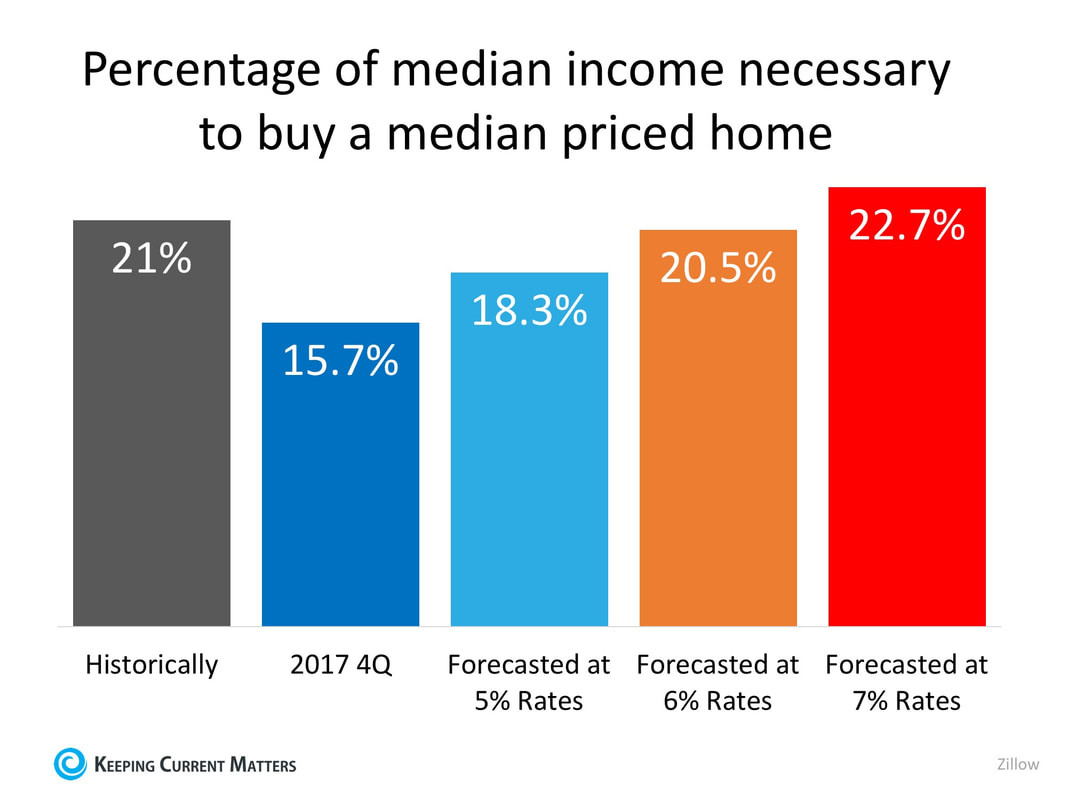 Rates would need to jump to 7% in order for the percentage of necessary income to be greater than historic norms.
Bottom Line Whether you are a homeowner considering selling your current house and moving up to the home of your dreams, or a first-time buyer trying to purchase your first home, it’s a great time to move forward. SOURCE KCM #ForBuyers #InterestRates #SimardRealtyGroup #eXpRealty  When it comes to buying a home, whether it is your first time or your fifth, it is always important to know all the facts. With the large number of mortgage programs available that allow buyers to purchase homes with down payments below 20%, you can never have too much information about Private Mortgage Insurance (PMI). What is PMI? Freddie Mac defines PMI as: “An insurance policy that protects the lender if you are unable to pay your mortgage. It’s a monthly fee, rolled into your mortgage payment, that is required for all conforming, conventional loans that have down payments less than 20%. Once you’ve built equity of 20% in your home, you can cancel your PMI and remove that expense from your mortgage payment.” As the borrower, you pay the monthly premiums for the insurance policy, and the lender is the beneficiary. Freddie Mac goes on to explain that: “The cost of PMI varies based on your loan-to-value ratio – the amount you owe on your mortgage compared to its value – and credit score, but you can expect to pay between $30 and $70 per month for every $100,000 borrowed.” According to the National Association of Realtors, the average down payment for all buyers last year was 10%. For first-time buyers, that number dropped to 5%, while repeat buyers put down 14% (no doubt aided by the sale of their homes). This just goes to show that for a large number of buyers last year, PMI did not stop them from buying their dream homes. Here’s an example of the cost of a mortgage on a $200,000 home with a 5% down payment & PMI, compared to a 20% down payment without PMI: 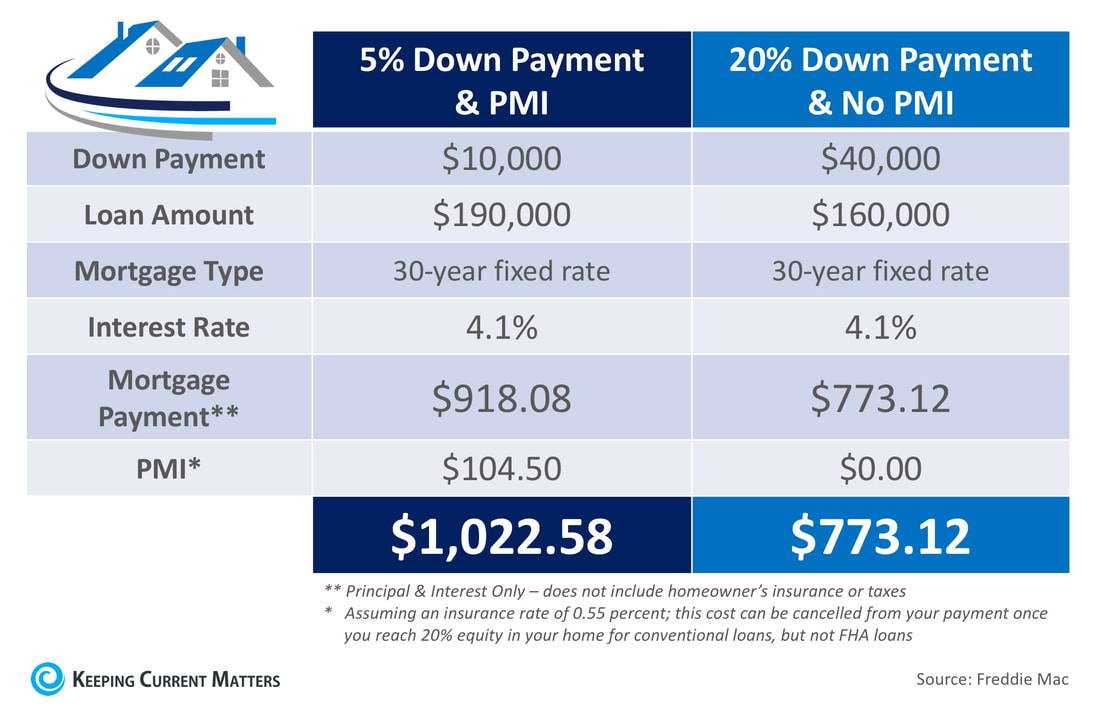 The larger the down payment you can make, the lower your monthly housing cost will be, but Freddie Mac urges you to remember:
“It’s no doubt an added cost, but it’s enabling you to buy now and begin building equity versus waiting 5 to 10 years to build enough savings for a 20% down payment.” Bottom Line If you have questions about whether you should buy now or wait until you’ve saved a larger down payment, meet with a professional in your area who can explain your market’s conditions and help you make the best decision for you and your family. SOURCE KCM #ForBuyers #PMI #SimardRealtyGroup #eXpRealty  According to the Beracha, Hardin & Johnson Buy vs. Rent (BH&J) Index, the U.S. housing market has continued to move deeper into buy territory, supporting the belief that housing markets across the country remain a sound investment.
The BH&J Index is a quarterly report that attempts to answer the question: In today’s housing market, is it better to rent or buy a home? The index examines the entire US housing market and then isolates 23 major cities for comparison. The researchers “measure the relationship between purchasing property and building wealth through a buildup in equity versus renting a comparable property and investing in a portfolio of stocks and bonds.” While 13 of the 23 metropolitan markets examined moved further into buy territory, markets like Dallas, Denver, and Houston are currently deep into rent territory. Due to a lack of inventory, the home prices in these areas have increased by 6.7%, 6.3%, and 5.3% respectively from a year ago. According to Eli Beracha, Ph.D., Co-Creator of the index, home prices will begin to return to more normal levels. “Our data indicates that prices are above their 40-year trend but not significantly so as they were in 2007. Rather than a crash, I anticipate slower growth in prices accompanied by longer marketing times for sellers and increasing inventories, which should bring prices back in conjunction with their 40-year trend.” Bottom Line The majority of the country is strongly in buy territory. Buying a home makes sense socially and financially, as rents are predicted to increase substantially in the next year. Protect yourself from rising rents by locking in your housing cost with a mortgage payment now. To Find Out More About the Study: The BH&J Index and other FAU real estate activities are sponsored by Investments Limited of Boca Raton. The BH&J Index is published quarterly and is available online at http://business.fau.edu/buyvsrent. SOURCE KCM #ForBuyers #RentvsBuy #SimardRealtyGroup #eXpRealty  Some Highlights:
SOURCE KCM #Buyers #Infographics #SimardRealtyGroup #eXpRealty  Why are home prices still rising? It is a simple answer. There are more purchasers in the market right now than there are available homes for them to buy. This is an example of the theory of “supply and demand” which is defined as: “the amount of a commodity, product, or service available and the desire of buyers for it, considered as factors regulating its price.” When demand exceeds supply, prices go up. This is currently happening in the residential real estate market. Here are the numbers for supply and demand as compared to last year for the last three months (March numbers are not yet available): 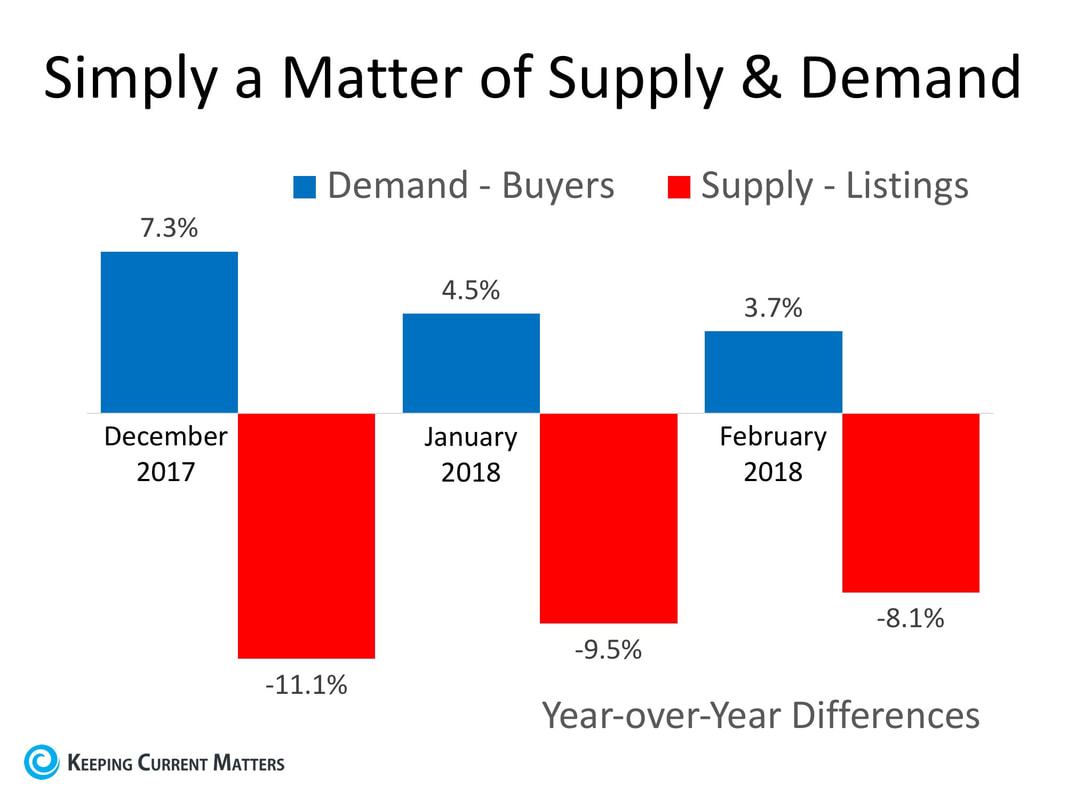 In each of the last three months, demand (buyer traffic) has increased as compared to last year while supply (number of available listings) has decreased. If this situation persists, home values will continue to increase.
Bottom Line The reason home prices are still rising is because there are many purchasers looking to buy, but very few homeowners ready to sell. This imbalance is the reason prices will remain on the uptick. SOURCE KCM #SupplyandDemand #SimardRealtyGroup #eXpRealty |
Archives
October 2022
Categories
All
|
 RSS Feed