 Home values have risen dramatically over the last twelve months. In CoreLogic’s most recent Home Price Index Report, they revealed that national home prices have increased by 6.7% year-over-year. CoreLogic broke down appreciation even further into four price ranges, giving us a more detailed view than if we had simply looked at the year-over-year increases in national median home price. The chart below shows the four price ranges from the report, as well as each one’s year-over-year growth from February 2017 to February 2018 (the latest data available)  It is important to pay attention to how prices are changing in your local market. The location of your home is not the only factor that determines how much your home has appreciated over the course of the last year.
Lower-priced homes have appreciated at greater rates than homes at the upper ends of the spectrum due to demand from first-time home buyers and baby boomers looking to downsize. Bottom Line If you are planning to list your home for sale in today’s market, find a local agent who can explain exactly what’s going on in your area and your price range. SOURCE KCM #ForBuyers #ForSellers #SimardRealtyGroup #eXpRealty
0 Comments
 With home prices rising again this year, some are concerned that we may be repeating the 2006 housing bubble that caused families so much pain when it collapsed. Today’s market is quite different than the bubble market of twelve years ago. There are four key metrics that explain why:
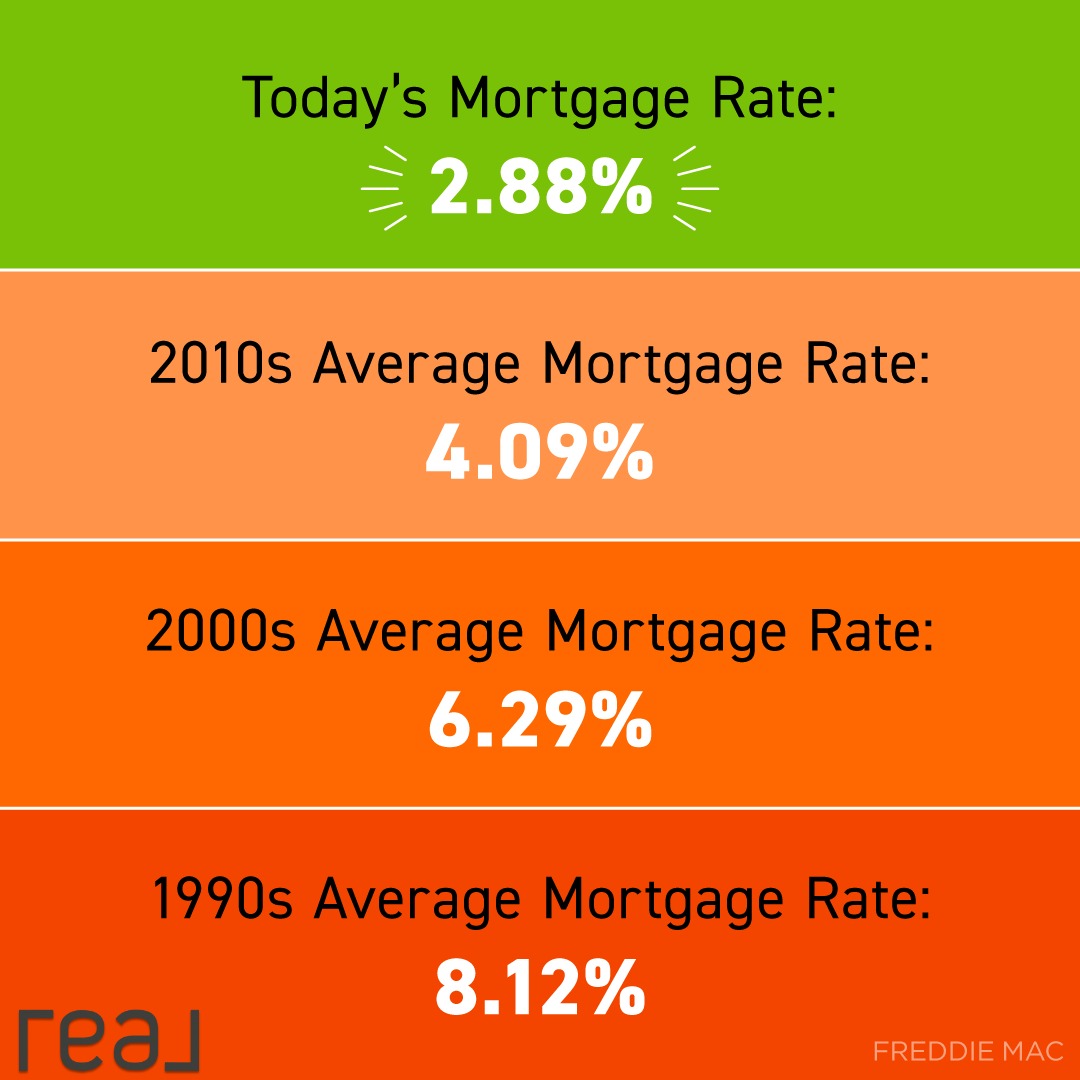
1. HOME PRICES There is no doubt that home prices have reached 2006 levels in many markets across the country. However, after more than a decade, home prices should be much higher based on inflation alone. Frank Nothaft is the Chief Economist for CoreLogic (which compiles some of the best data on past, current, and future home prices). Nothaft recently explained: “Even though CoreLogic’s national home price index got to the same level it was at the prior peak in April of 2006, once you account for inflation over the ensuing 11.5 years, values are still about 18% below where they were.” (emphasis added) 2. MORTGAGE STANDARDS Some are concerned that banks are once again easing lending standards to a level similar to the one that helped create the last housing bubble. However, there is proof that today’s standards are nowhere near as lenient as they were leading up to the crash. The Urban Institute’s Housing Finance Policy Center issues a Housing Credit Availability Index (HCAI).According to the Urban Institute: “The HCAI measures the percentage of home purchase loans that are likely to default—that is, go unpaid for more than 90 days past their due date. A lower HCAI indicates that lenders are unwilling to tolerate defaults and are imposing tighter lending standards, making it harder to get a loan. A higher HCAI indicates that lenders are willing to tolerate defaults and are taking more risks, making it easier to get a loan.” The graph below reveals that standards today are much tighter on a borrower’s credit situation and have all but eliminated the riskiest loan products. 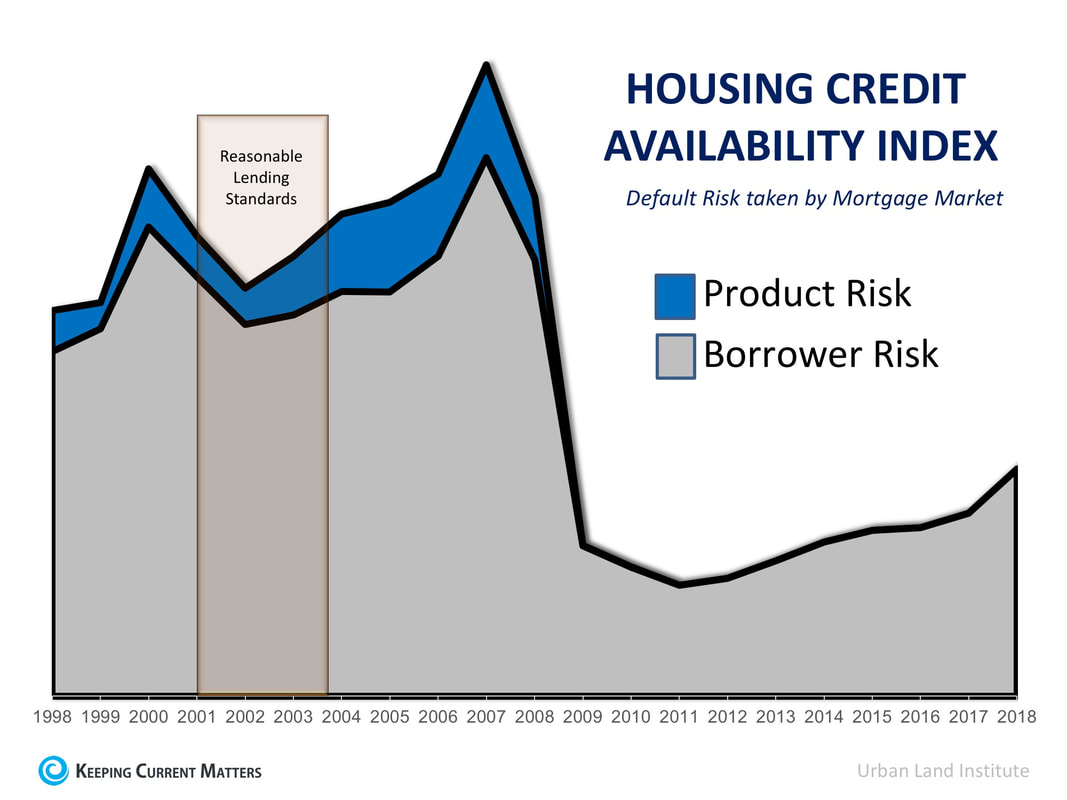 3. MORTGAGE DEBT Back in 2006, many homeowners mistakenly used their homes as ATMs by withdrawing their equity and spending it with no concern for the ramifications. They overloaded themselves with mortgage debt that they couldn’t (or wouldn’t) repay when prices crashed. That is not occurring today. The best indicator of mortgage debt is the Federal Reserve Board’s household Debt Service Ratio for mortgages, which calculates mortgage debt as a percentage of disposable personal income. At the height of the bubble market a decade ago, the ratio stood at 7.21%. That meant over 7% of disposable personal income was being spent on mortgage payments. Today, the ratio stands at 4.48% – the lowest level in 38 years! 4. HOUSING AFFORDABILITY With both house prices and mortgage rates on the rise, there is concern that many buyers may no longer be able to afford a home. However, when we look at the Housing Affordability Index released by the National Association of Realtors, homes are more affordable now than at any other time since 1985 (except for when prices crashed after the bubble popped in 2008). 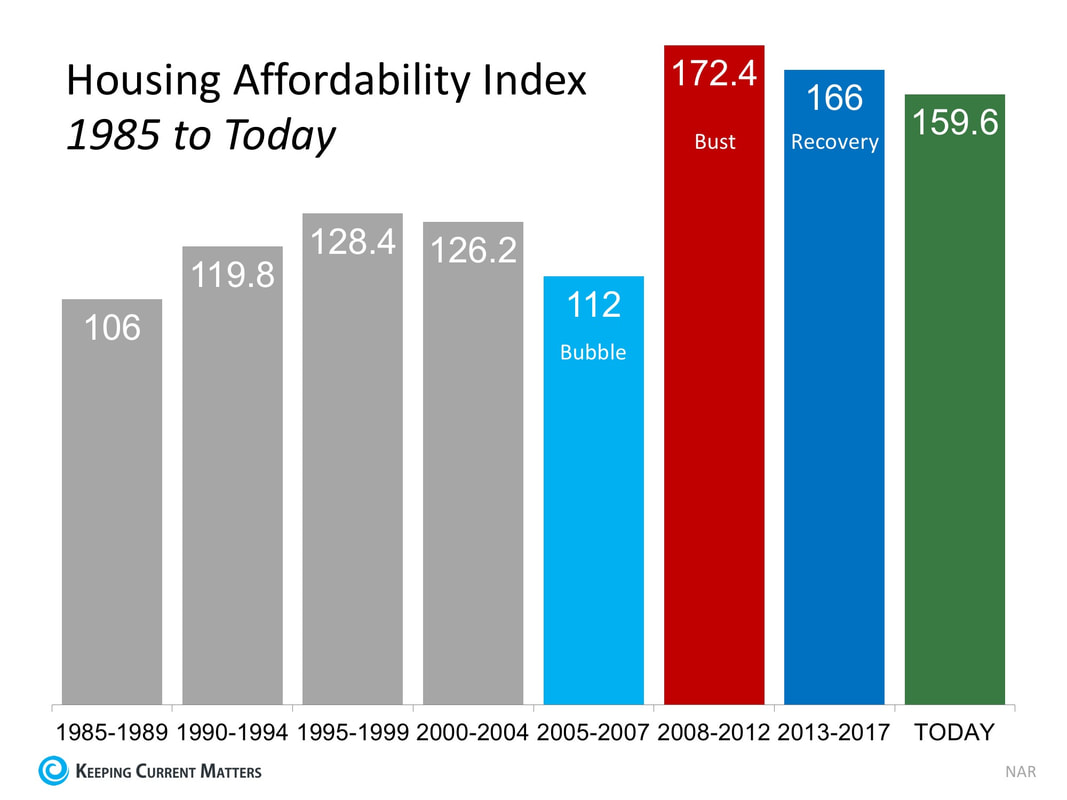 Bottom LineAfter using four key housing metrics to compare today to 2006, we can see that the current market is not anything like the bubble market.
SOURCE KCM #InterestRates #Pricing #SimardRealtyGroup #eXpRealty  According to a newly released study by ATTOM Data Solutions, selling your home in the month of May will net you an average of 5.9% above estimated market value for your home. For the study, ATTOM performed an “analysis of 14.7 million home sales from 2011 to 2017” and found the average seller premium achieved for each month of the year. Below is a breakdown by month: 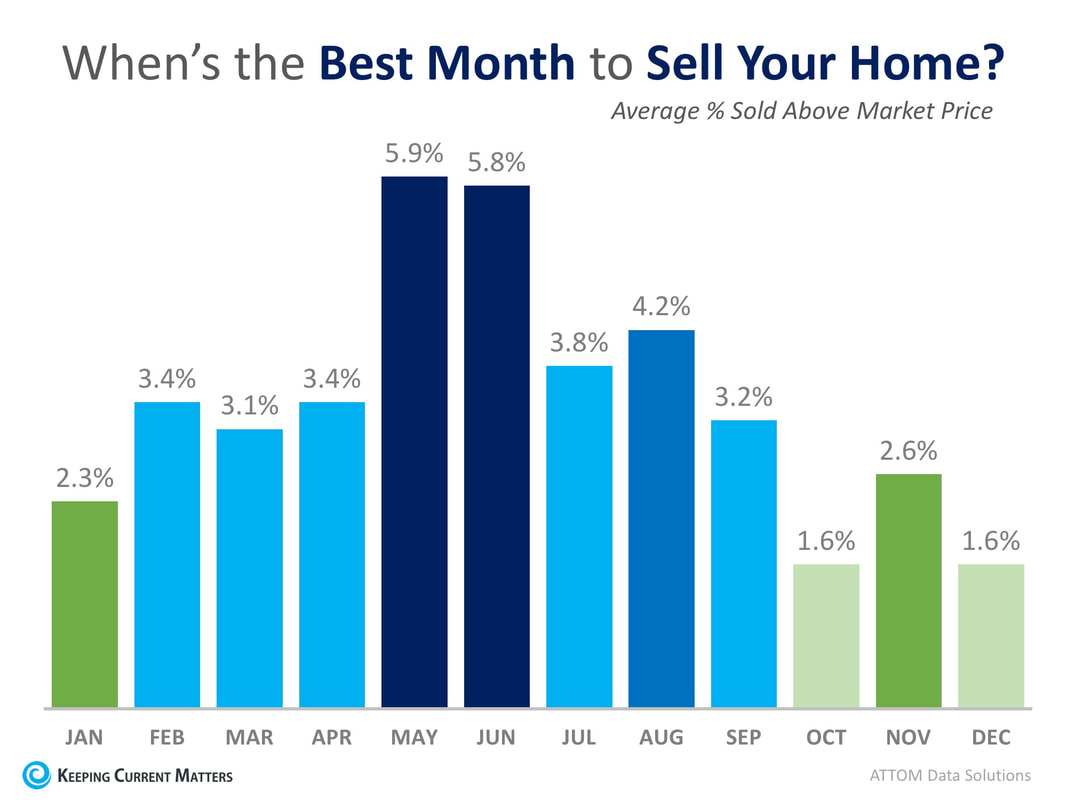 ATTOM even went a step further and broke their results down by day.
Top 5 Days to Sell:
It should come as no surprise that May and June dominate as the top months to sell and that 4 of the top 5 days to sell fall in those two months. The second quarter of the year (April, May, June) is referred to as the Spring Buyers Season, when competition is fierce to find a dream home, which often leads to bidding wars. One caveat to mention though, is that when broken down by metro, ATTOM noticed that while warmer climates share in the overall trend, it turns out that they have different top months for sales. The best month to get the highest price in Miami, FL, for instance, was January, and Phoenix, AZ came in with November leading the charge. If you’re thinking of selling your home this year, the time to list is NOW! According to the National Association of Realtors, homes sold in an average of just 30 days last month! If you list now, you’ll have a really good chance to sell in May or June, setting yourself up for getting the best price! Bottom Line Contact a local real estate professional who can show you the market conditions in your area and get the most exposure to the buyers who are ready and willing to buy! SOURCE KCM #Pricing #Sellers #SimardRealtyGroup #eXpRealty  Home values have risen dramatically over the last twelve months. In CoreLogic’s most recent Home Price Index Report, they revealed that national home prices have increased by 6.7% year-over-year. CoreLogic broke down appreciation even further into four price ranges, giving us a more detailed view than if we had simply looked at the year-over-year increases in national median home price. The chart below shows the four price ranges from the report, as well as each one’s year-over-year growth from February 2017 to February 2018 (the latest data available). 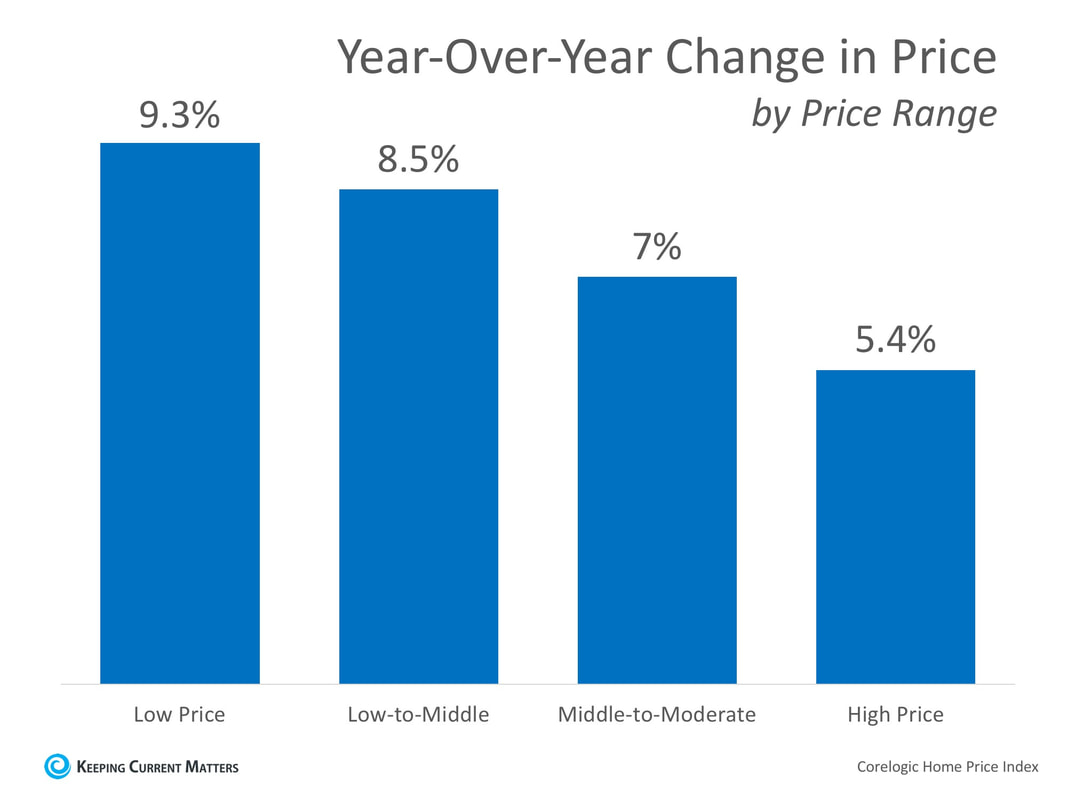 It is important to pay attention to how prices are changing in your local market. The location of your home is not the only factor that determines how much your home has appreciated over the course of the last year.
Lower-priced homes have appreciated at greater rates than homes at the upper ends of the spectrum due to demand from first-time home buyers and baby boomers looking to downsize. Bottom Line If you are planning to list your home for sale in today’s market, find a local agent who can explain exactly what’s going on in your area and your price range. SOURCE KCM #ForBuyers #ForSellers #SimardRealtyGroup #eXpRealty |
Archives
October 2022
Categories
All
|
 RSS Feed